
How to Calculate Conversion Rates in Google Data Studio
Looker Studio Masterclass, my advanced & premium course, is now publicly available. 100% for free!
No signups, upsell funnels, order bumps, or nonsense!
Access here >>

Ahmad Kanani
Introduction
One of the important metrics for the success of online businesses is the conversion rate. Conversion rate, in simple words, is the percentage of your total website visitors that complete your desired goal.
In this tutorial, I'm going to show you how to calculate the conversion rate between product clicks and add-to-carts using Google Analytics events and report it using Google Data Studio.
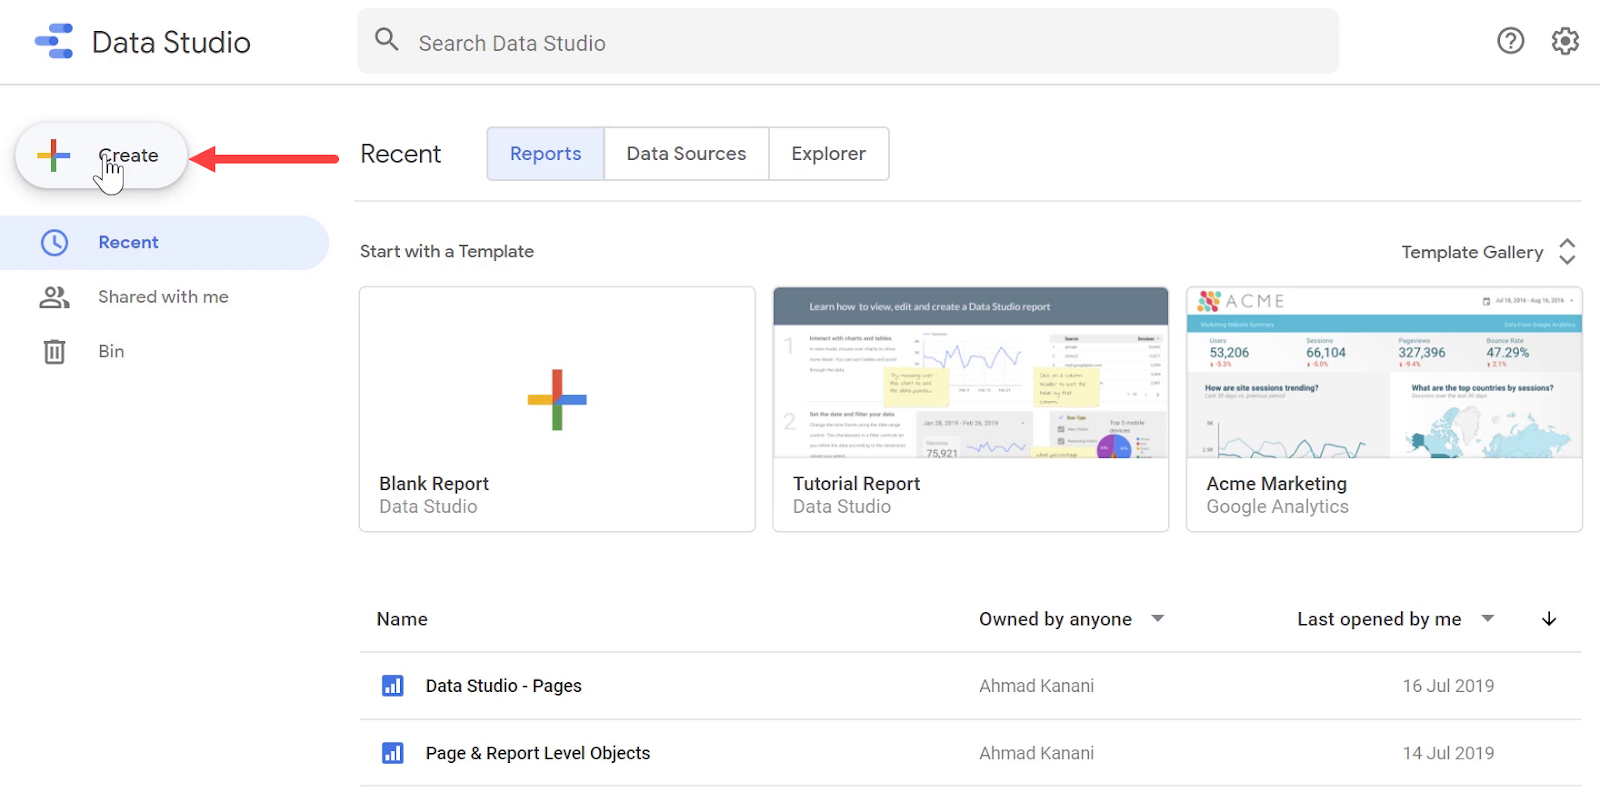
1. Creating a New Report
First, open Google Data Studio and create a new report.
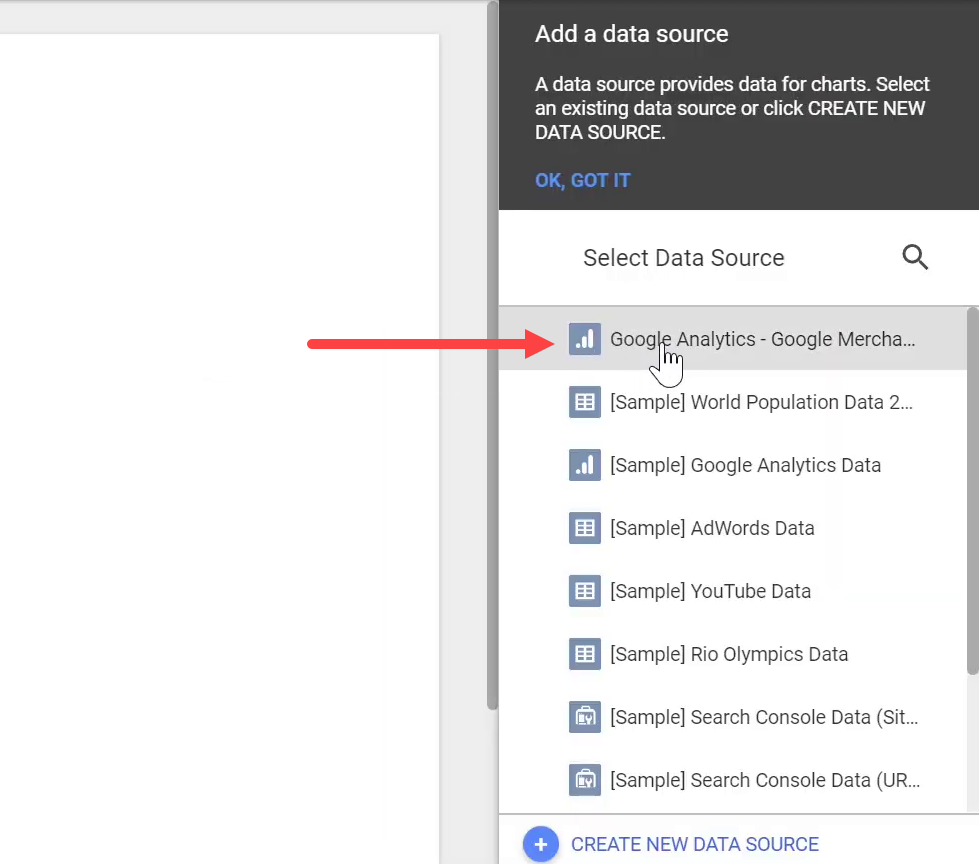
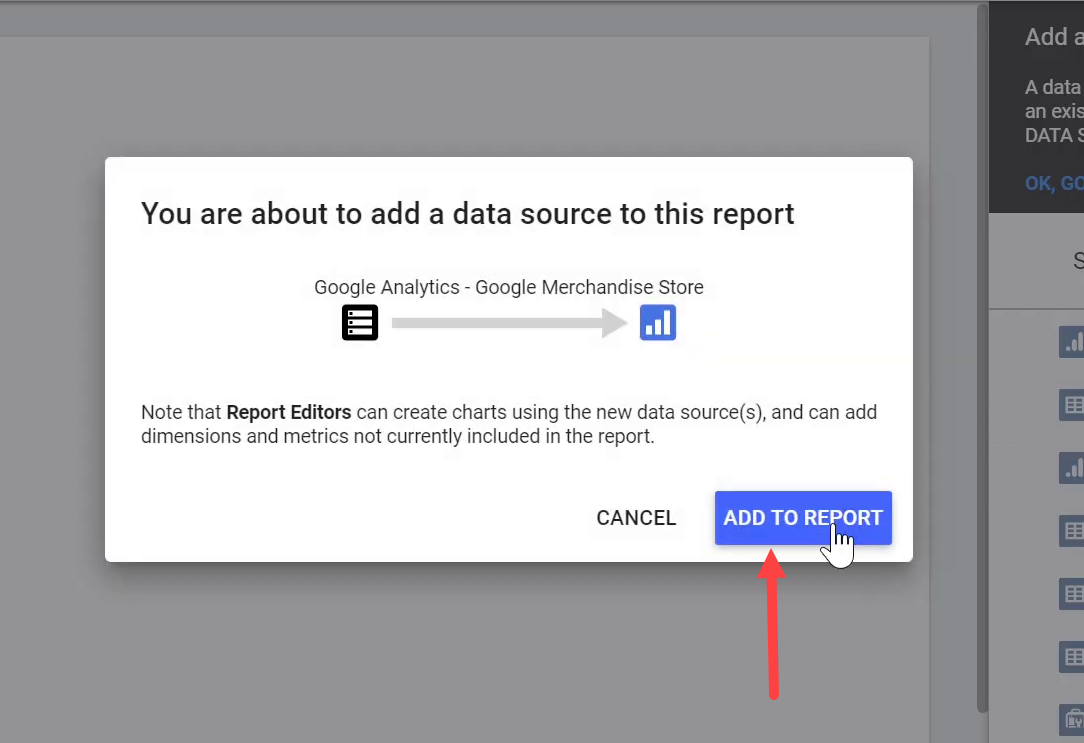
Connect it to Google Analytics - Google Merchandise Store data source by choosing it from the list, and clicking ADD TO REPORT.
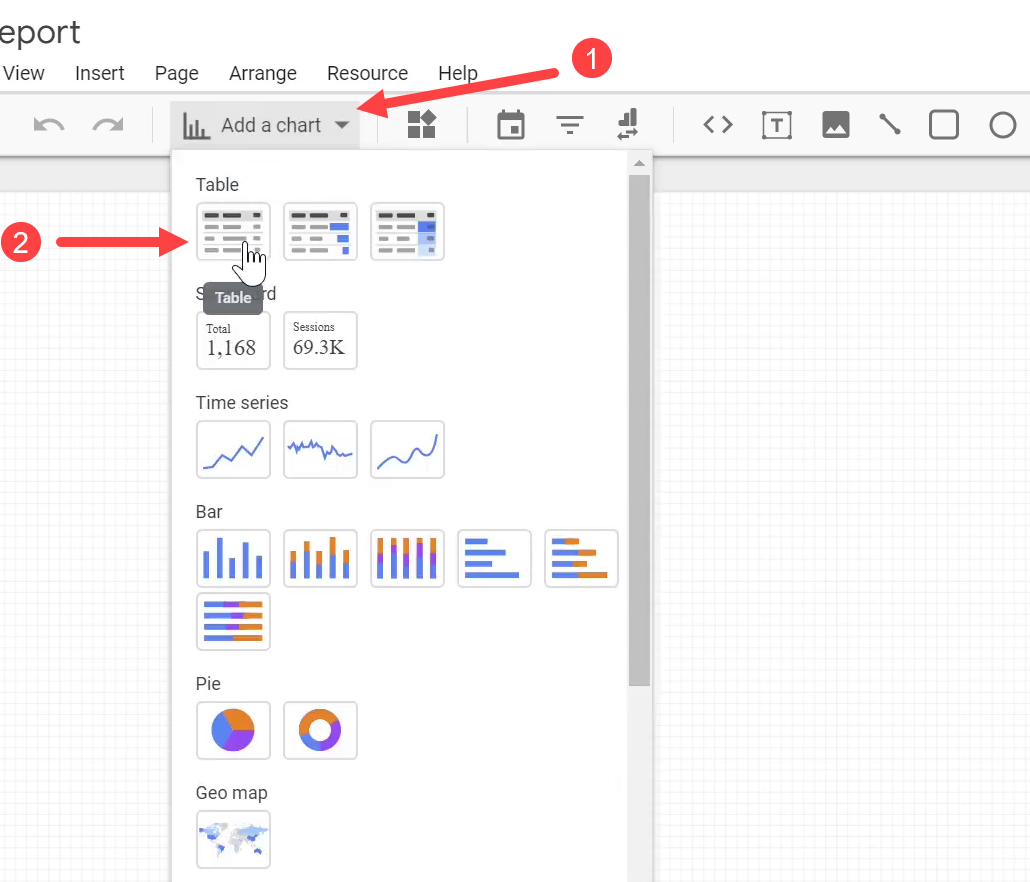
2. Creating Table of Events
Click on Add a chart and add a table.
For the dimensions, let’s add Event Category, Event Action, and Event Label from the DATA tab.
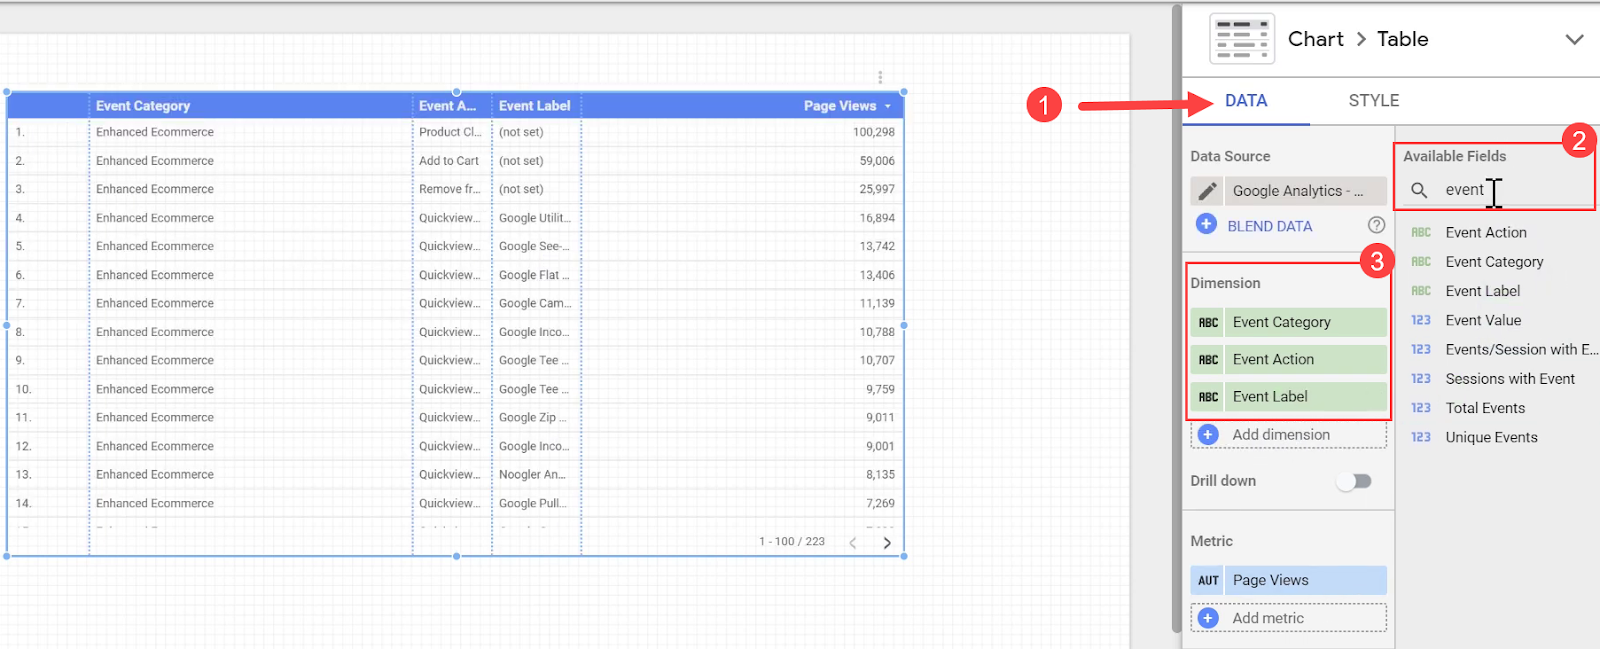
For the metric, let’s add Total Events to see the total number of events.
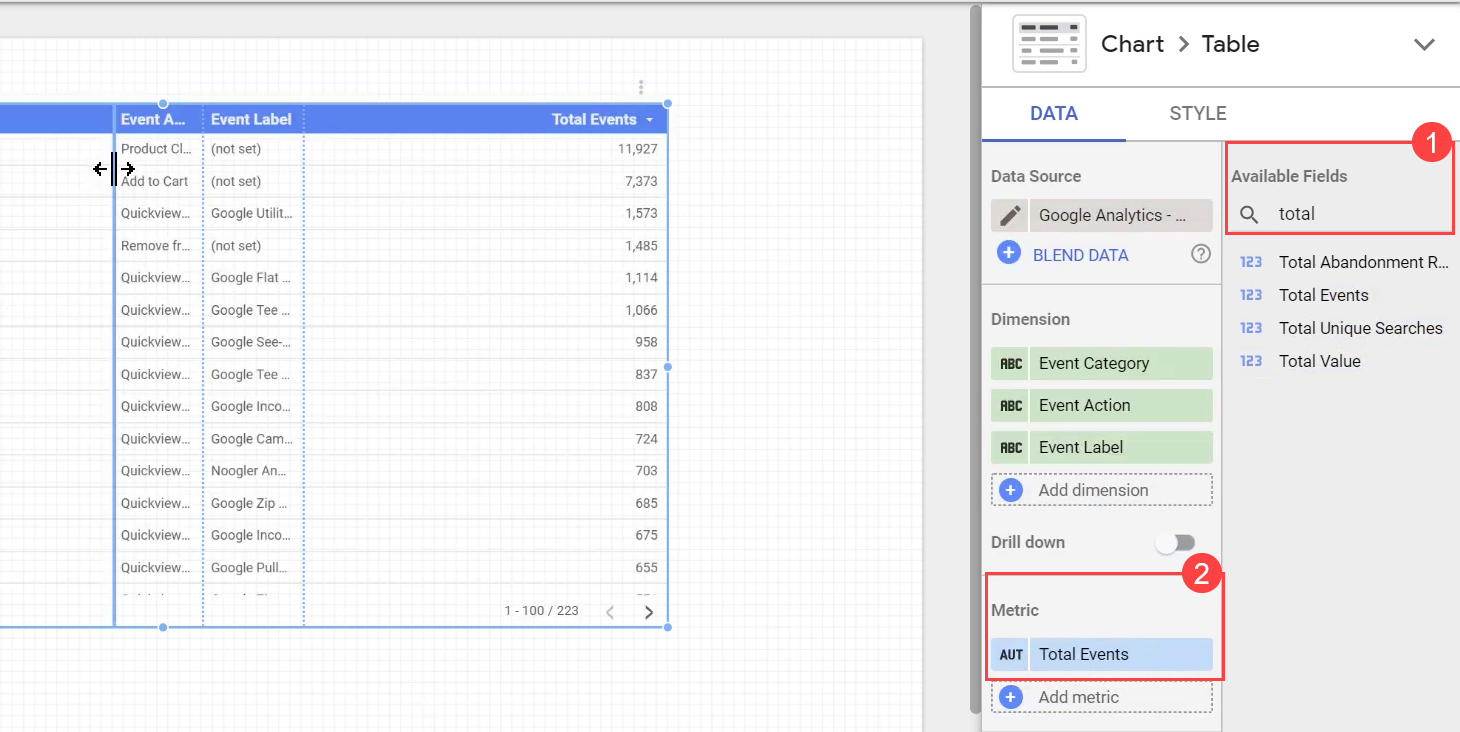
To quickly adjust the width of columns in any of the tables in Google Data Studio, you can double click on the edges of each column.
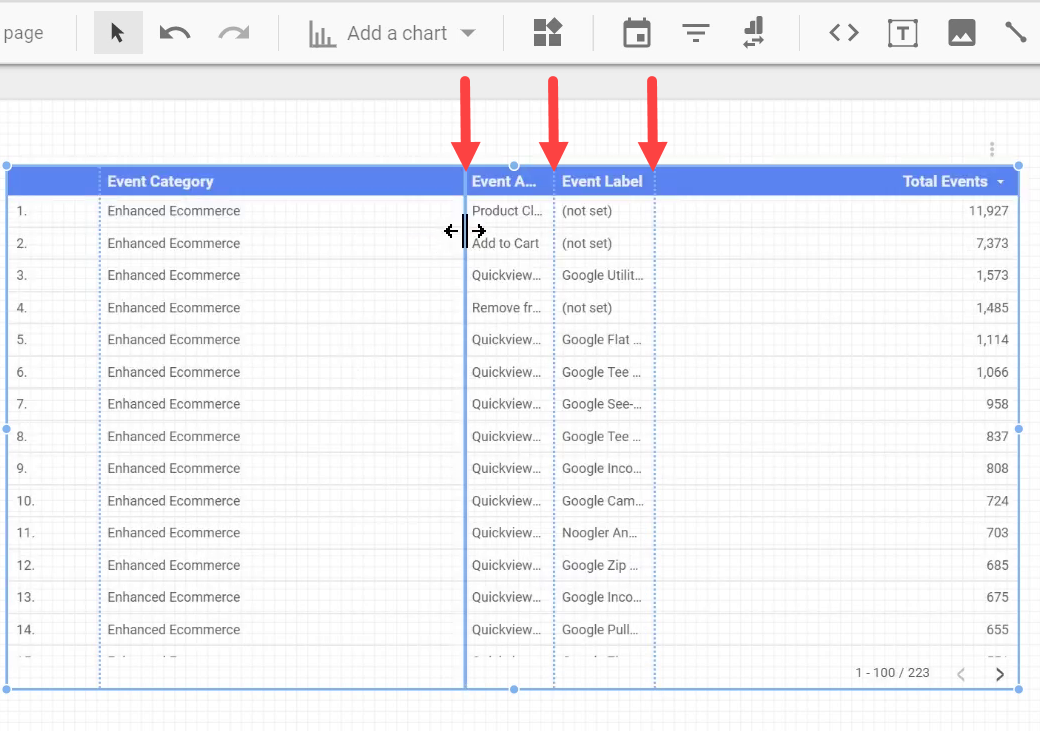
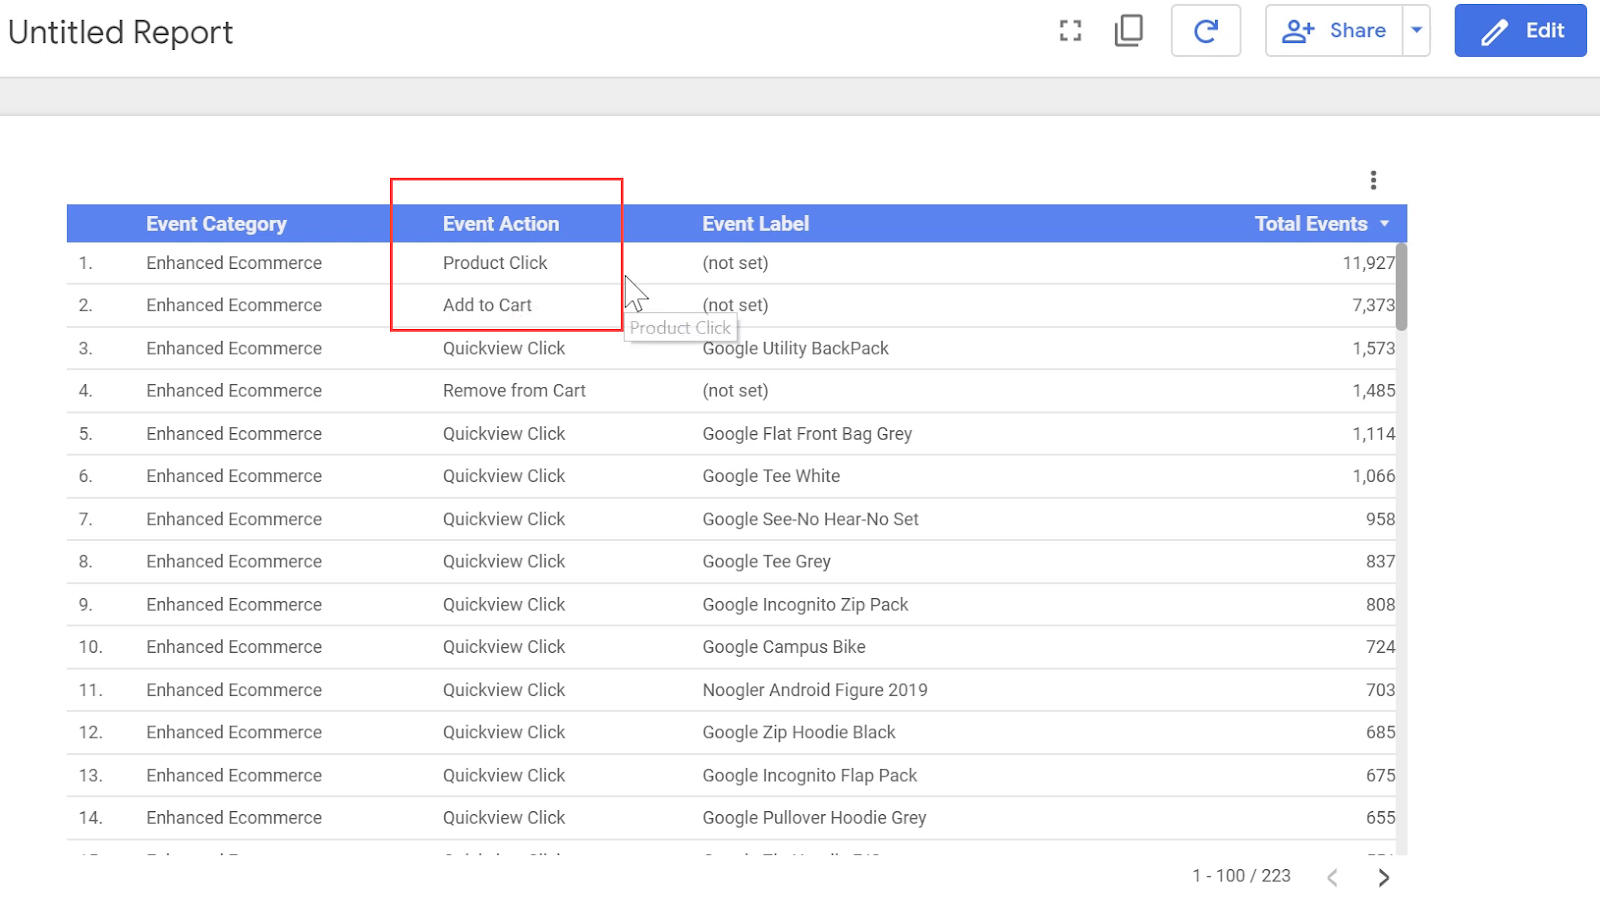
Now let’s view our report and see what kind of events we have.
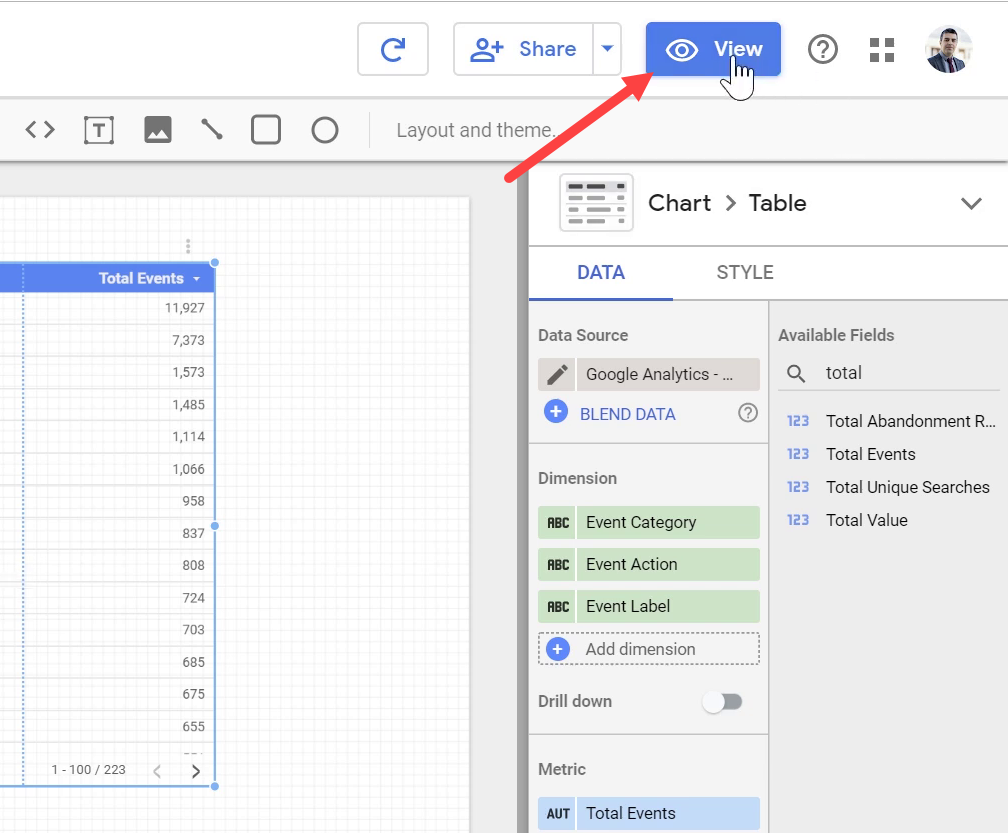
As you can see, we have so many events on our list. For calculating the Add to Cart Ratio, we need to use Product Click and Add To Cart event actions.
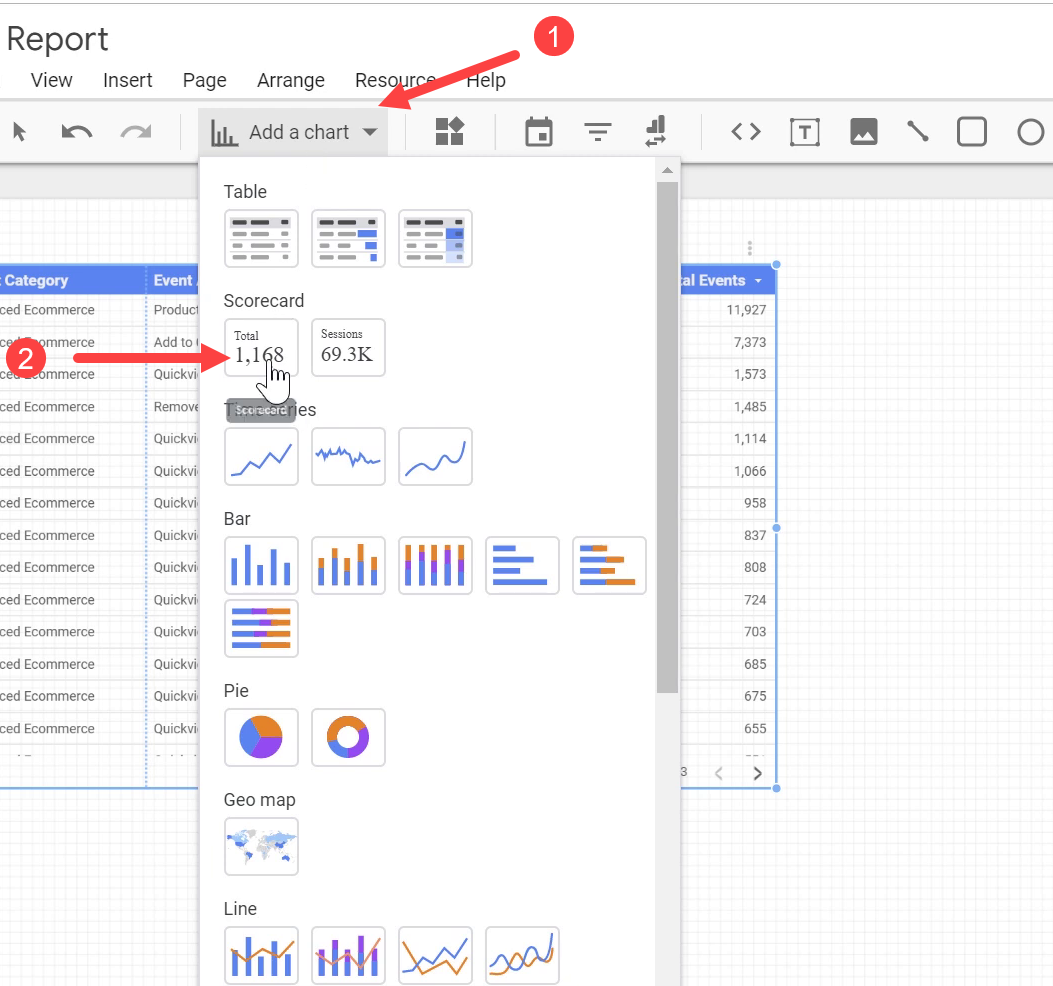
3. Adding Scorecards to the report
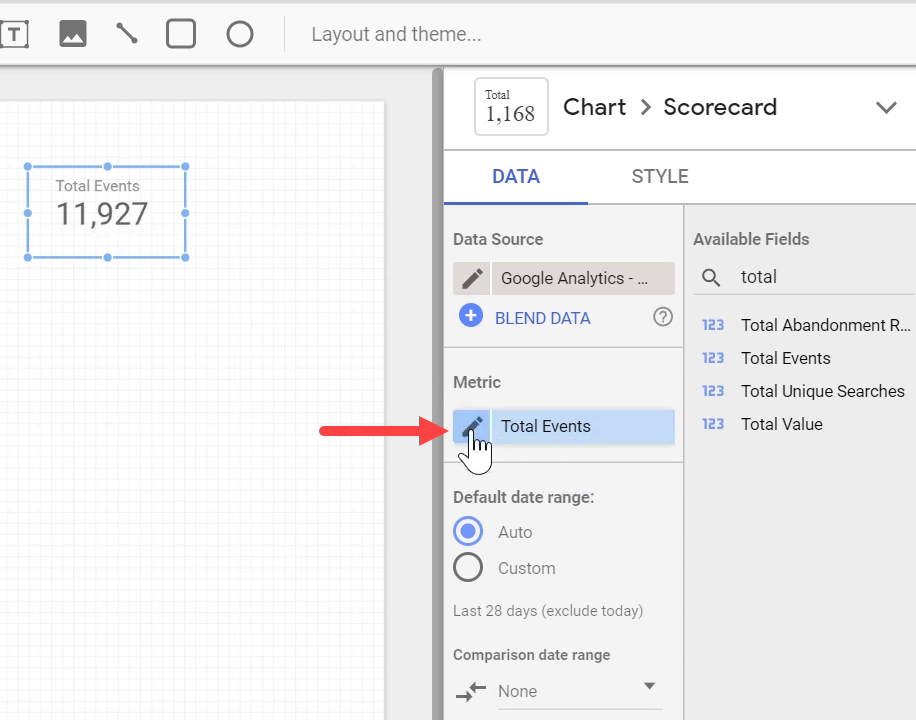
Let’s get back to Edit mode and add a scorecard to the report.
In order to change this scorecard to a calculated metric, click on Metric in the DATA tab and then click CREATE FIELD.
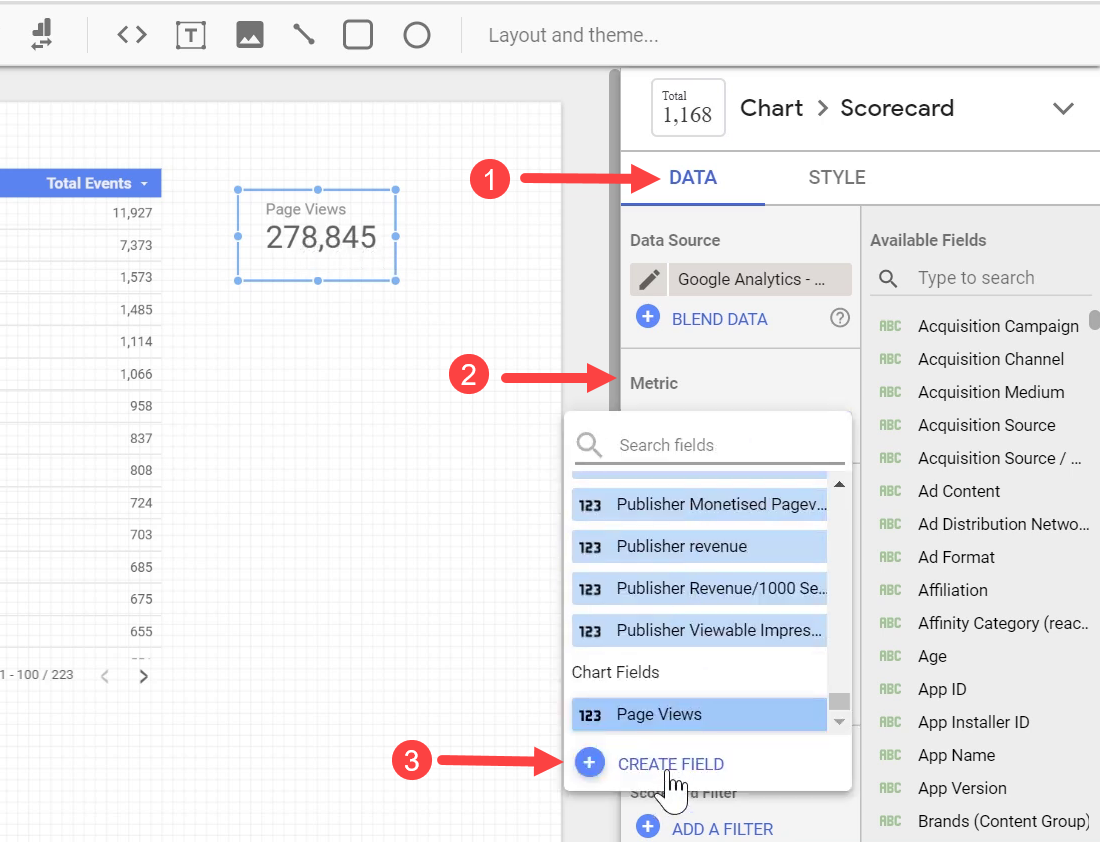
We can give it an optional name and then enter the formula for it. In normal formulas, we can divide a metric by another metric, or add a metric to another one, etc.
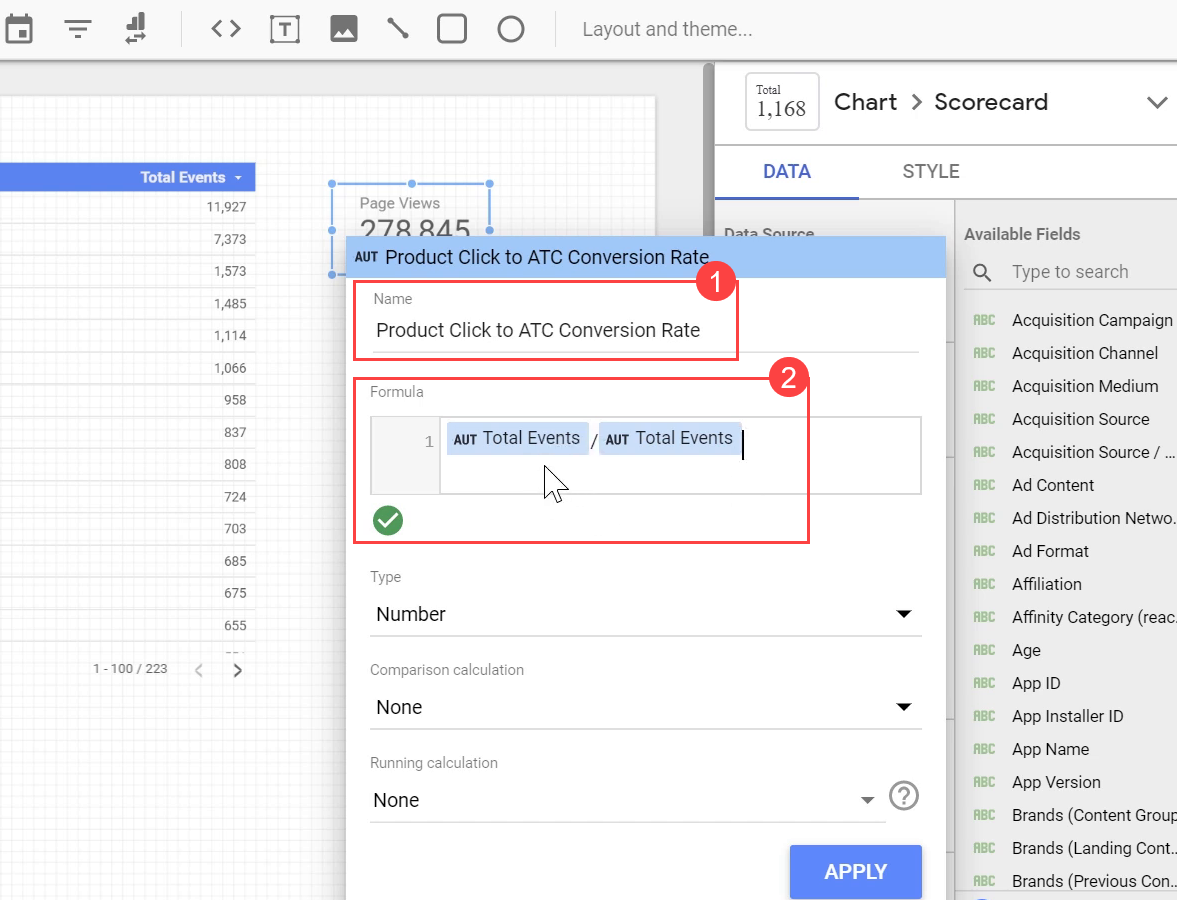
We can do arithmetic calculations with any two metrics that we want, but we cannot do the same with a subset of each metric. So here, we cannot use a normal formula to calculate the ratio of Product Click to Add to Cart events, because each is a subset of Total Events..
Instead, let’s first add a scorecard for our main metric, which is Total Events.

We can verify the total number of events by adding Summary Row to our table.
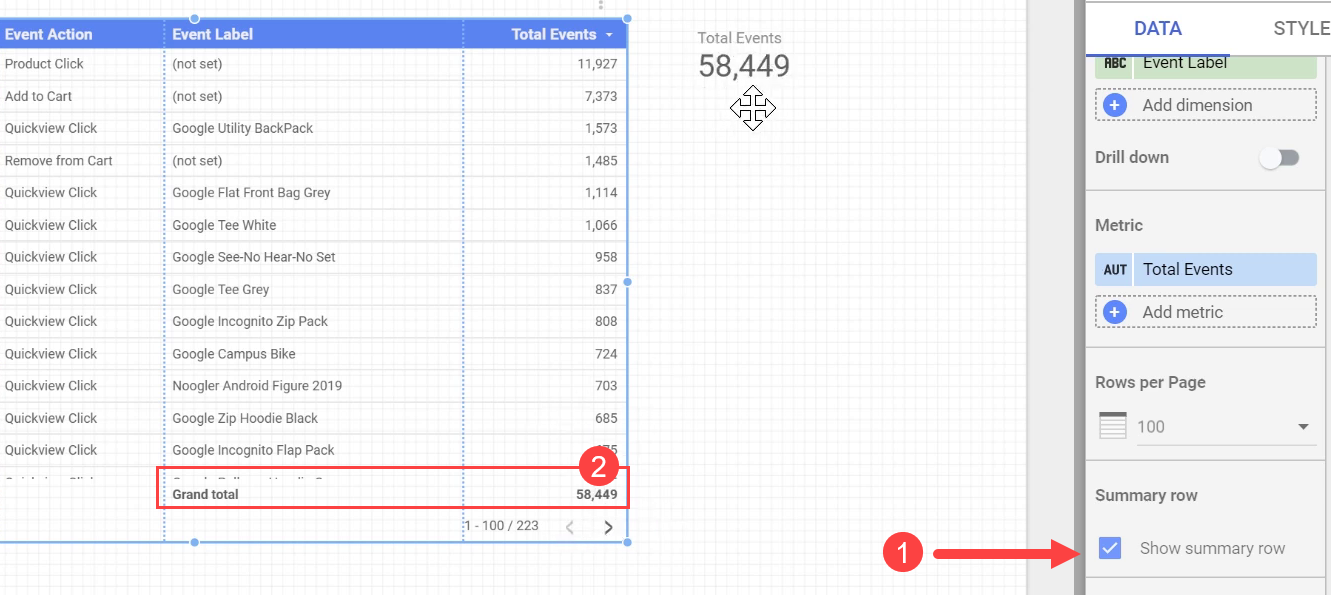
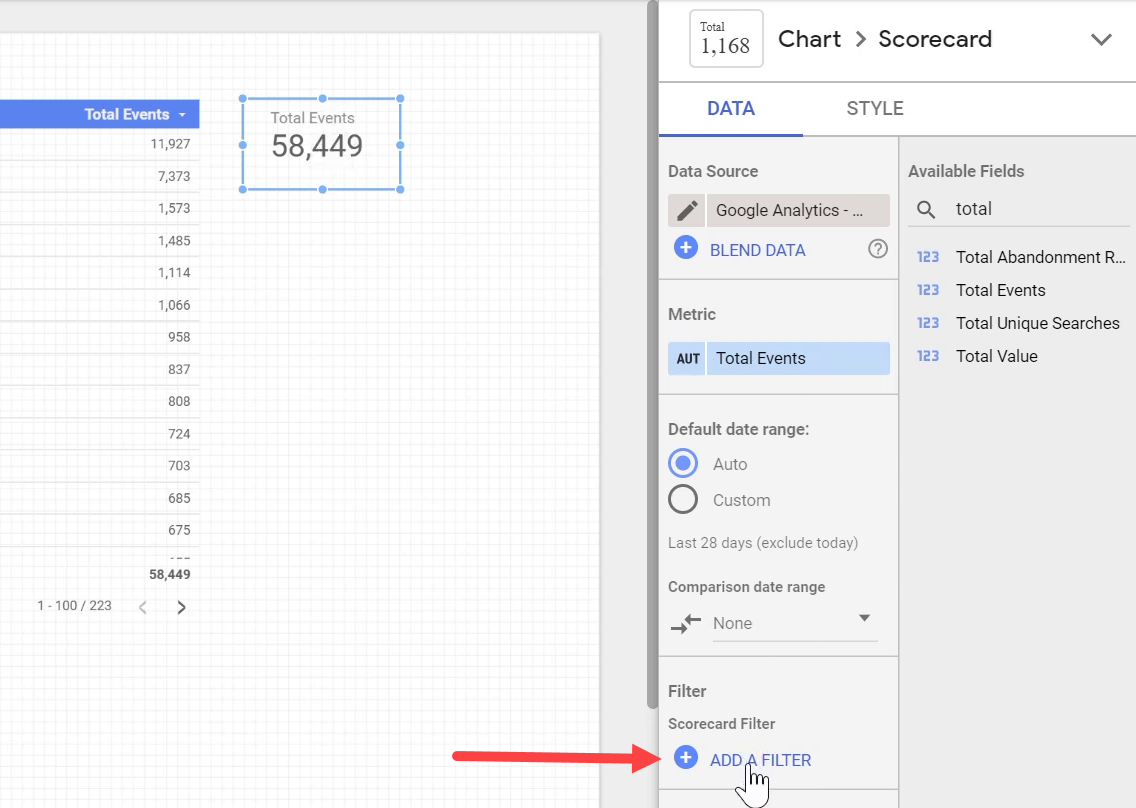
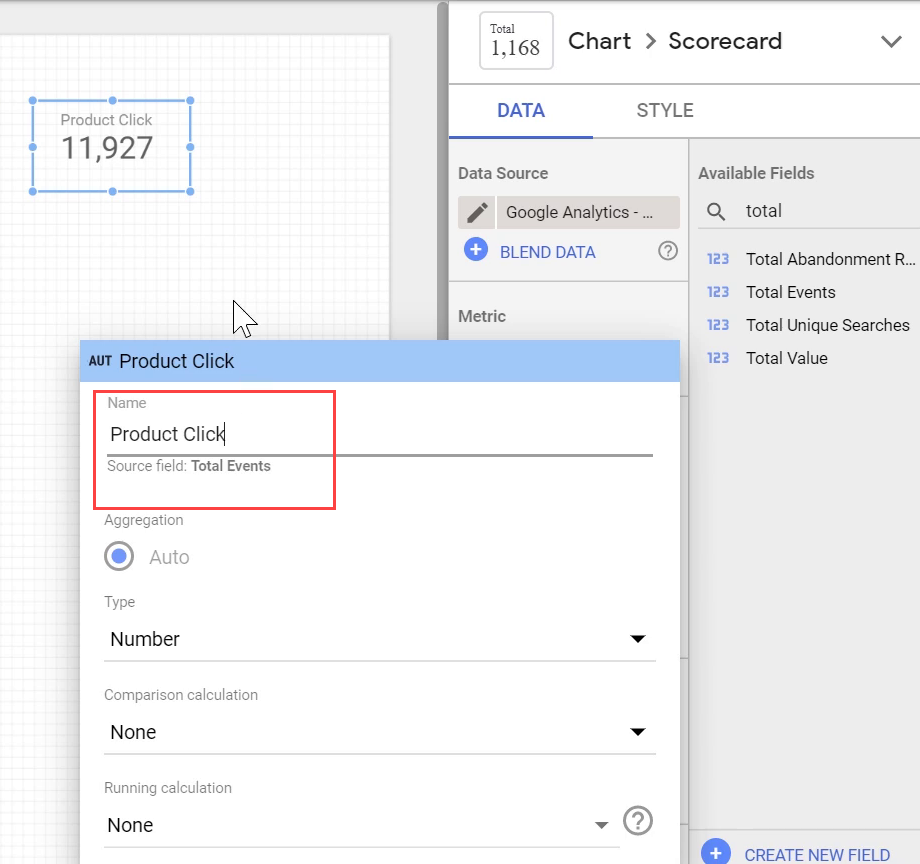
But here, we need the number of total events for Product Click event action. In order to have this number, we should add a filter to our scorecard.
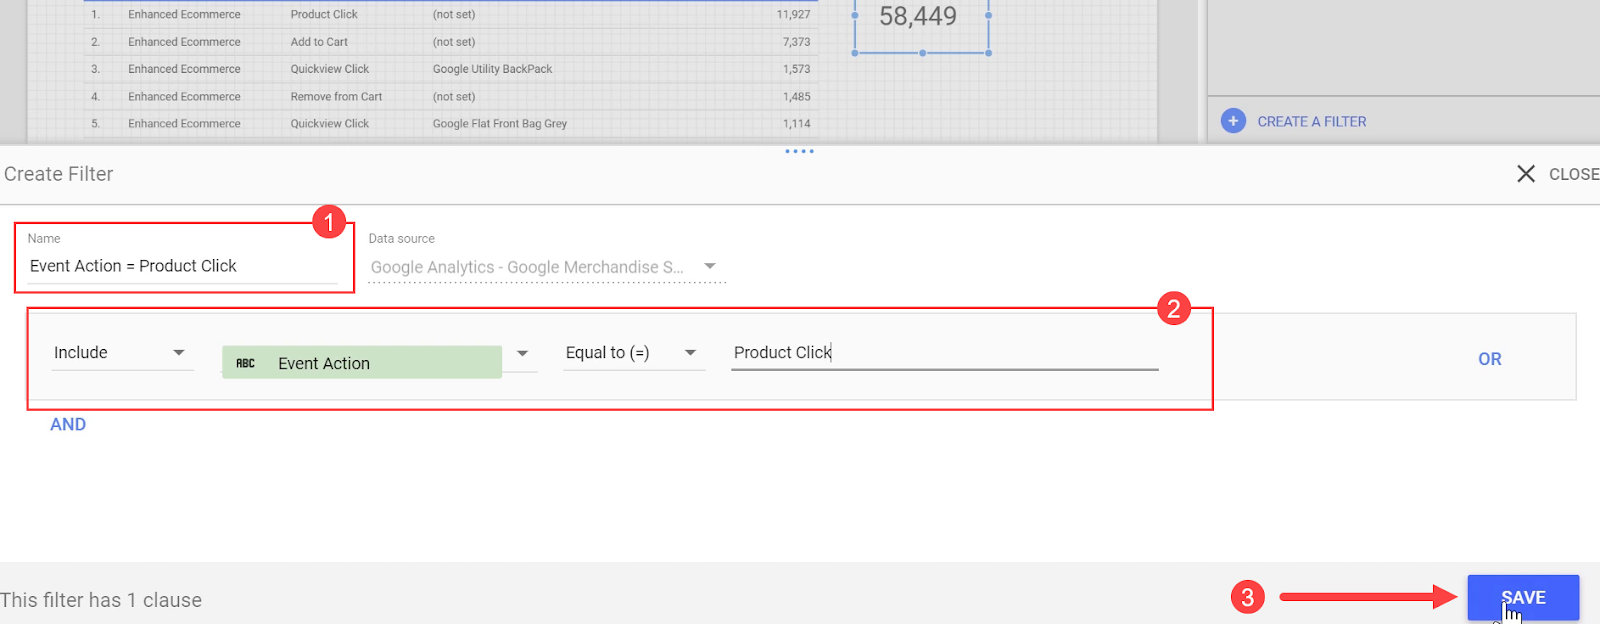
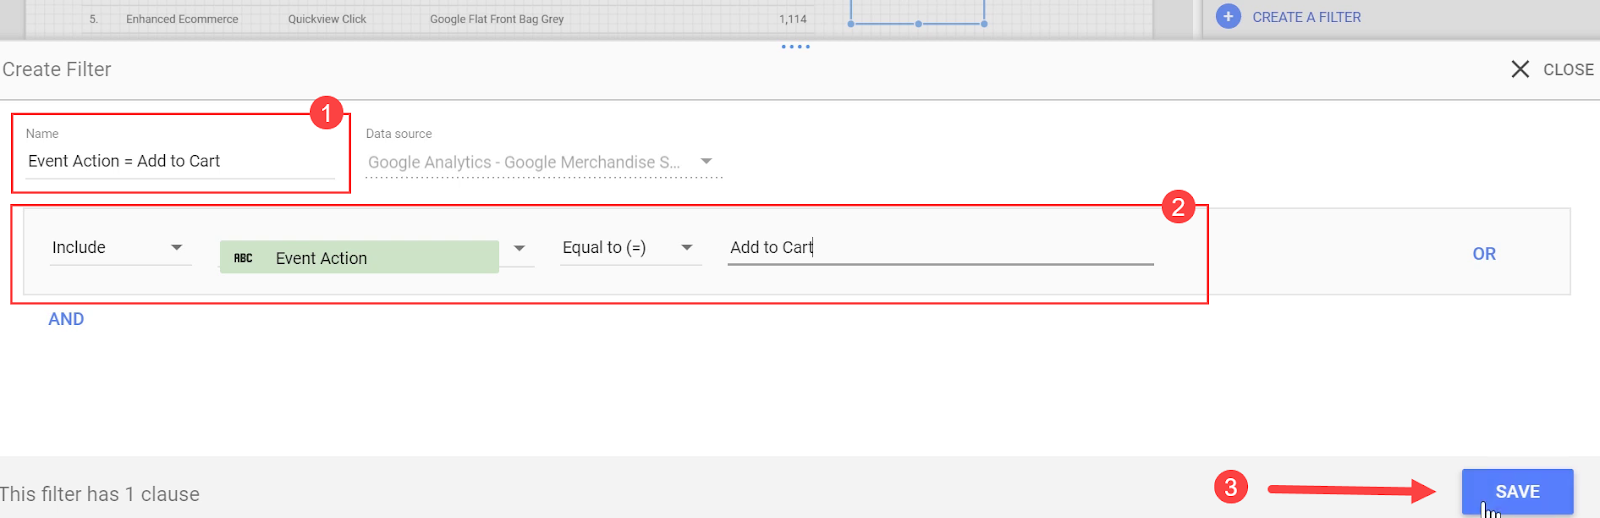
Let’s give the filter an optional name so that in the future we can easily recognize its function by taking a quick look at it. Set the criteria for when Event Action equals to Product Click. Then click SAVE button.
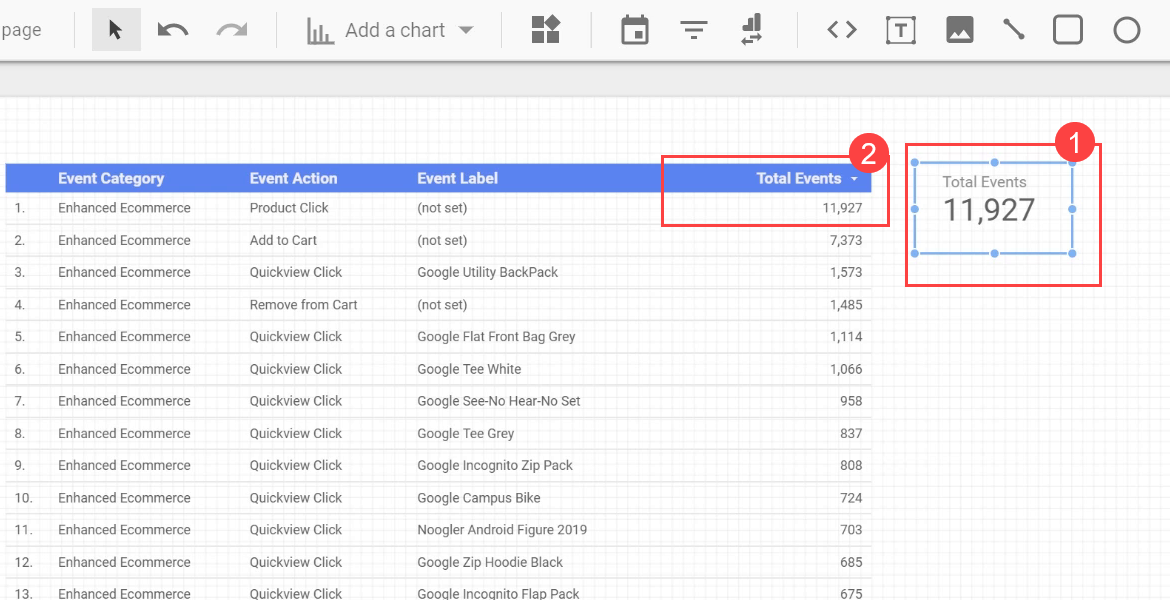
Now, our scorecard’s value is equal to Product Click and does not show total events anymore. It is a filtered version of Total Events so let’s change the title of the metric to avoid any confusion.
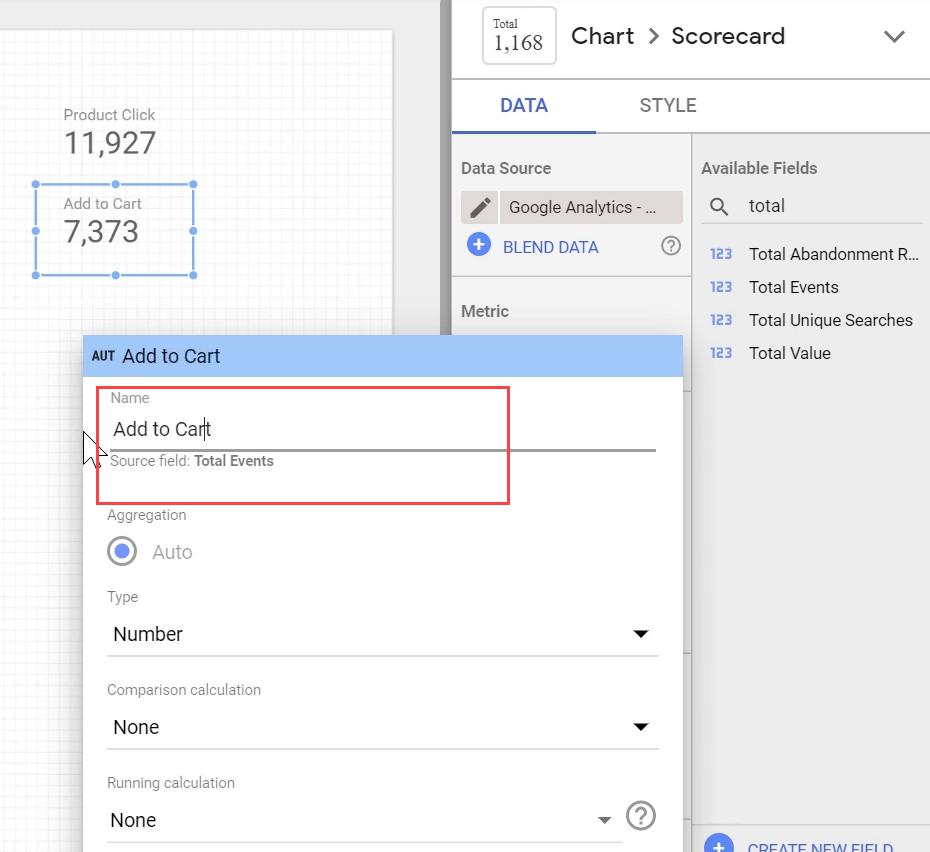
Now, let’s add another scorecard for Add to Cart metric. To do this, right click the current scorecard and select Duplicate or simply copy and paste it. Doing so will retain its styling and configuration. Similar to what we did for the previous scorecard, let’s add a filter to this scorecard, too.
Now, the number of our new scorecard matches the total amount of Add to Cart event actions from the table.

We can also rename it for more clarification.
4. Blending the Scorecards
Now that we have both of the metrics that we need, let’s select both scorecards, right click, and then choose Blend data.

A new scorecard appears on the report. Unlike the two other scorecards, the Data Source of our new scorecard is Blended Data which is a combination of two data sources.
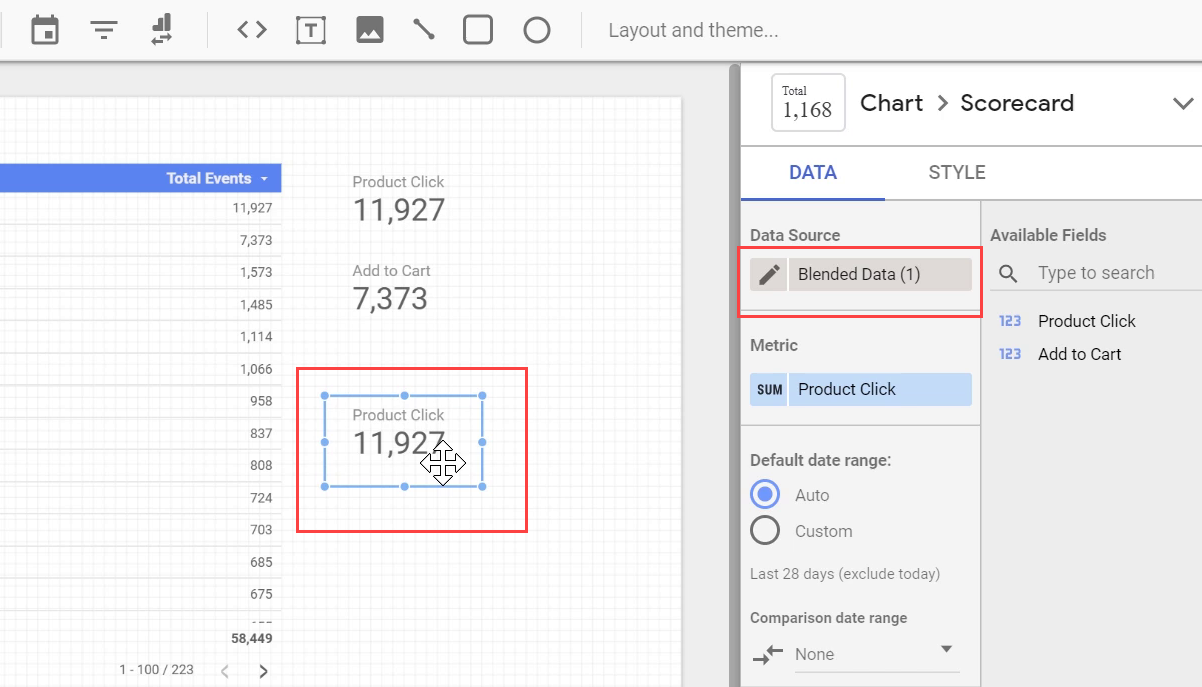
Therefore, we only have two metrics available in this Blended Data: Product Click and Add to Cart.
5. Calculating the Conversion Rate
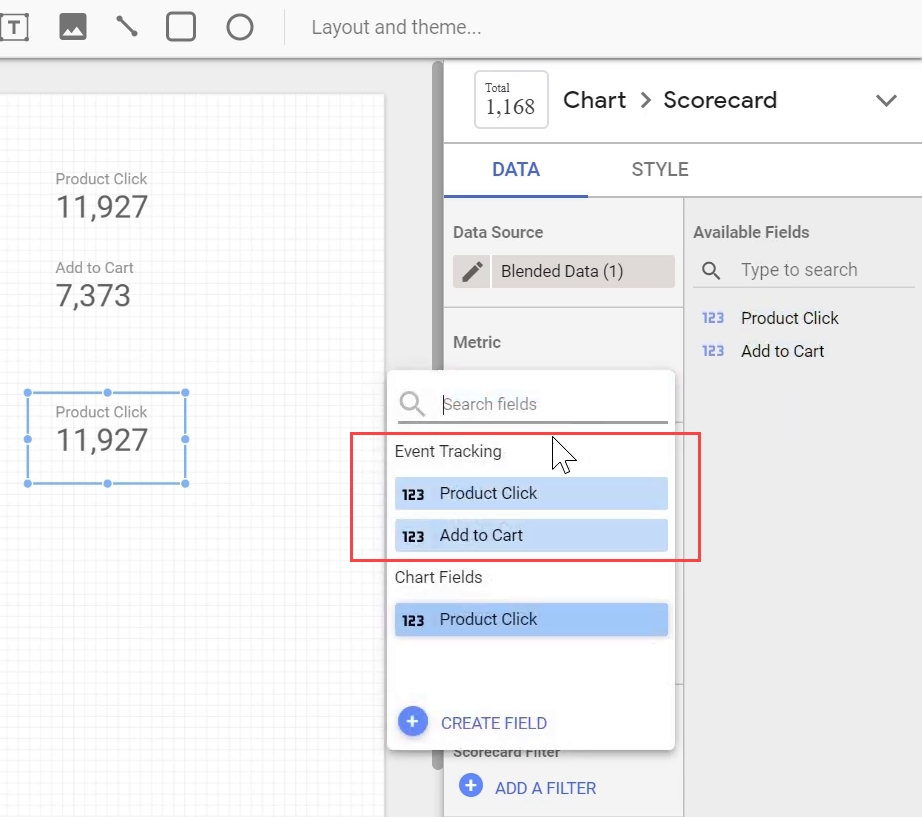
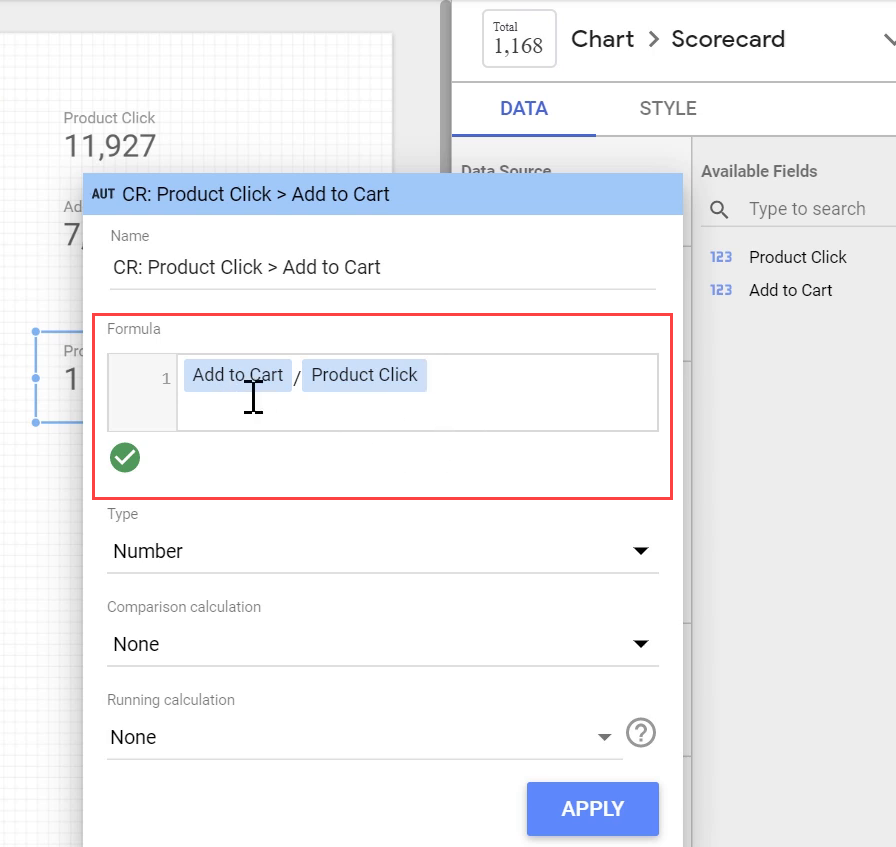
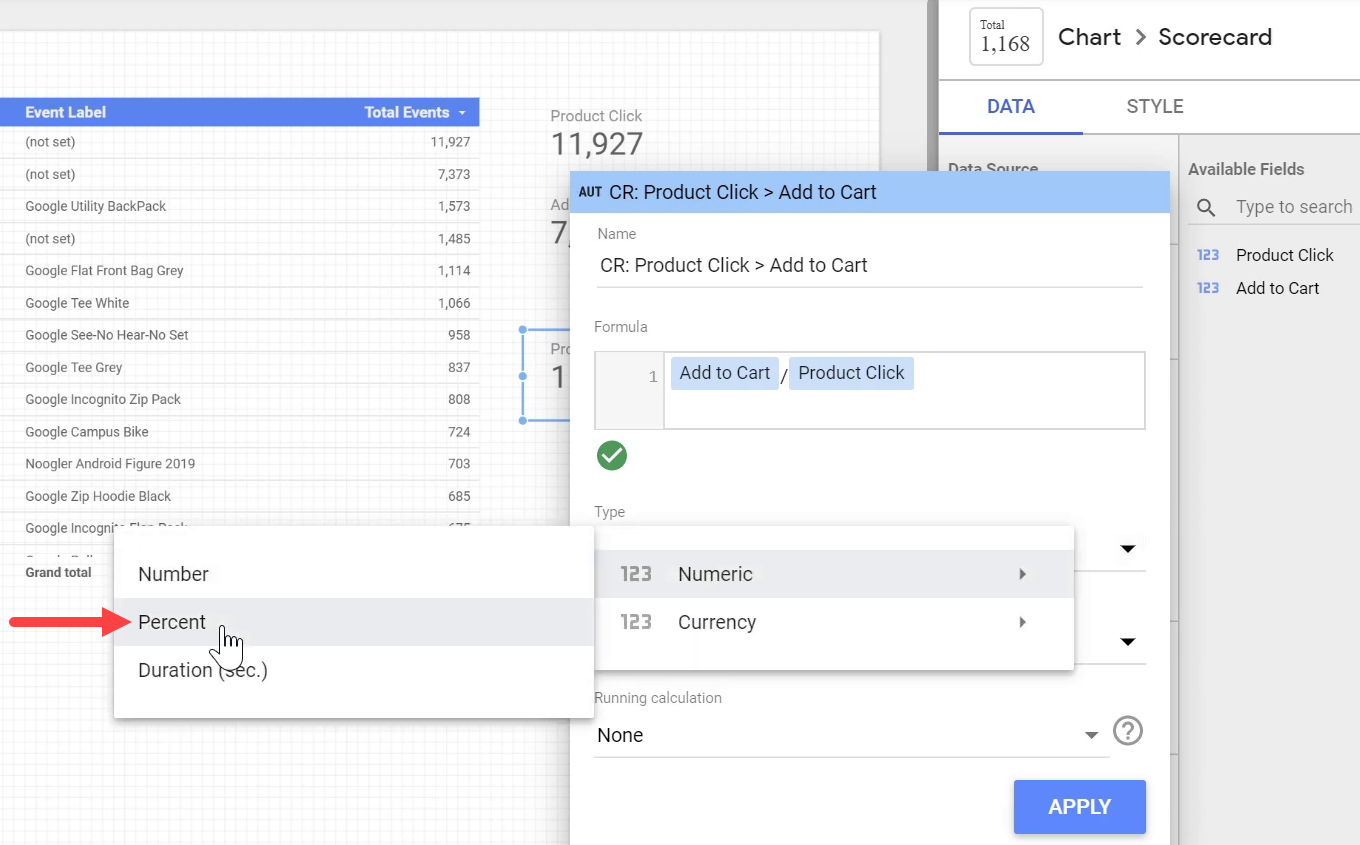
Select the new blended scorecard and click CREATE FIELD from the Metric section. Note that here, we don't have Total Events in this blended data set anymore. We can only divide Add to Cart by Product Click,
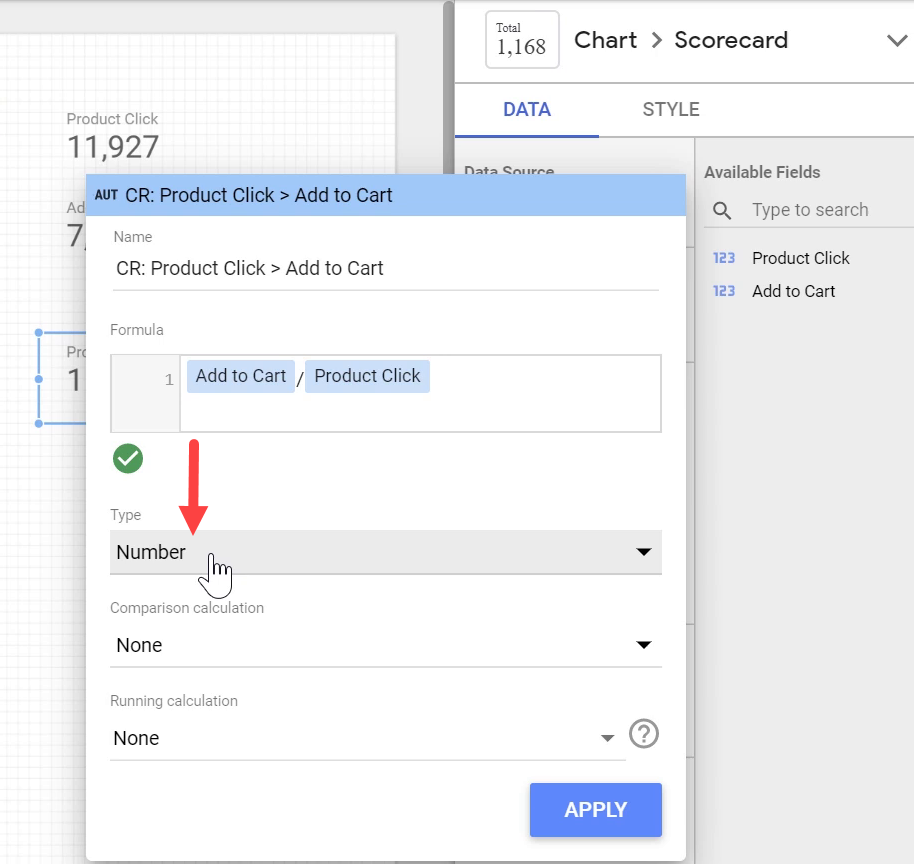
Currently, we will get a number as the result of dividing these two metrics. But, what we need is a percentage. Therefore, click on Type, change it to Percent, and click APPLY.
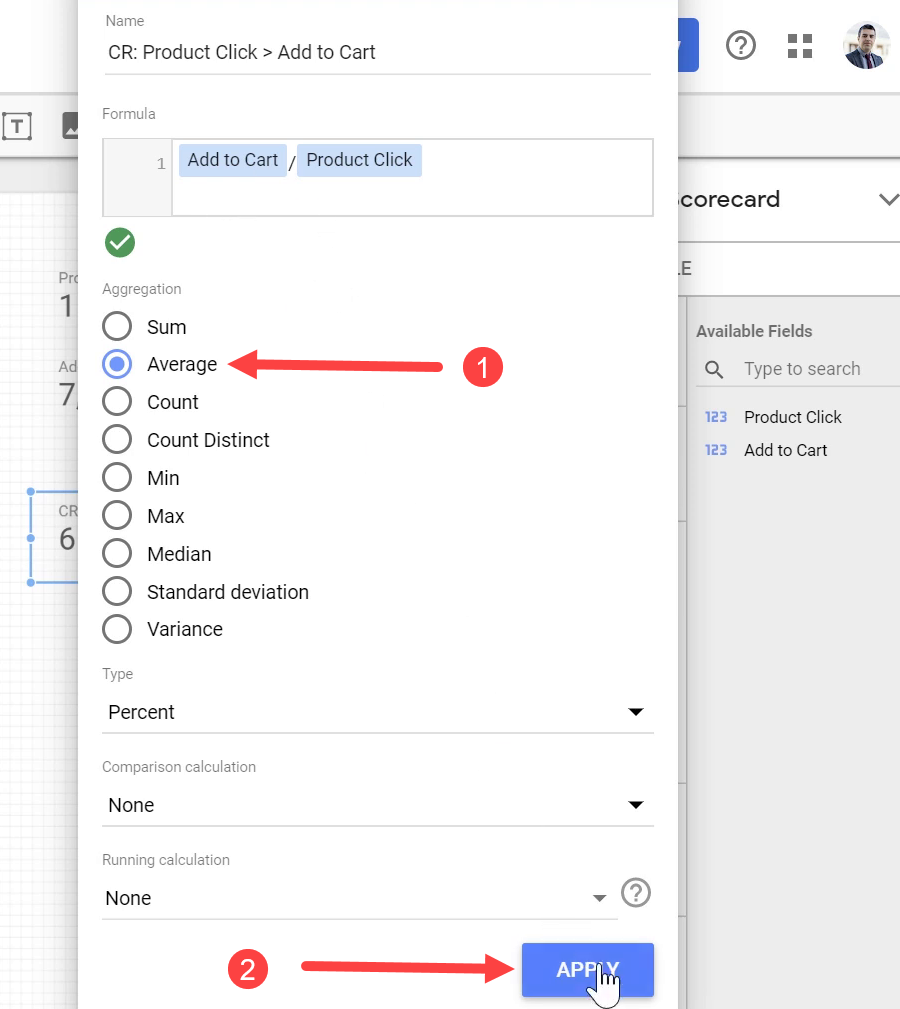
The correct way of creating such ratio metrics using formulas is to use the syntax below:
SUM(Add to Cart)/SUM(Product Click)
When using the above syntax, Data Studio will automatically take care of the type of aggregation required to report the ratio, and the only aggregation type available will be Auto.
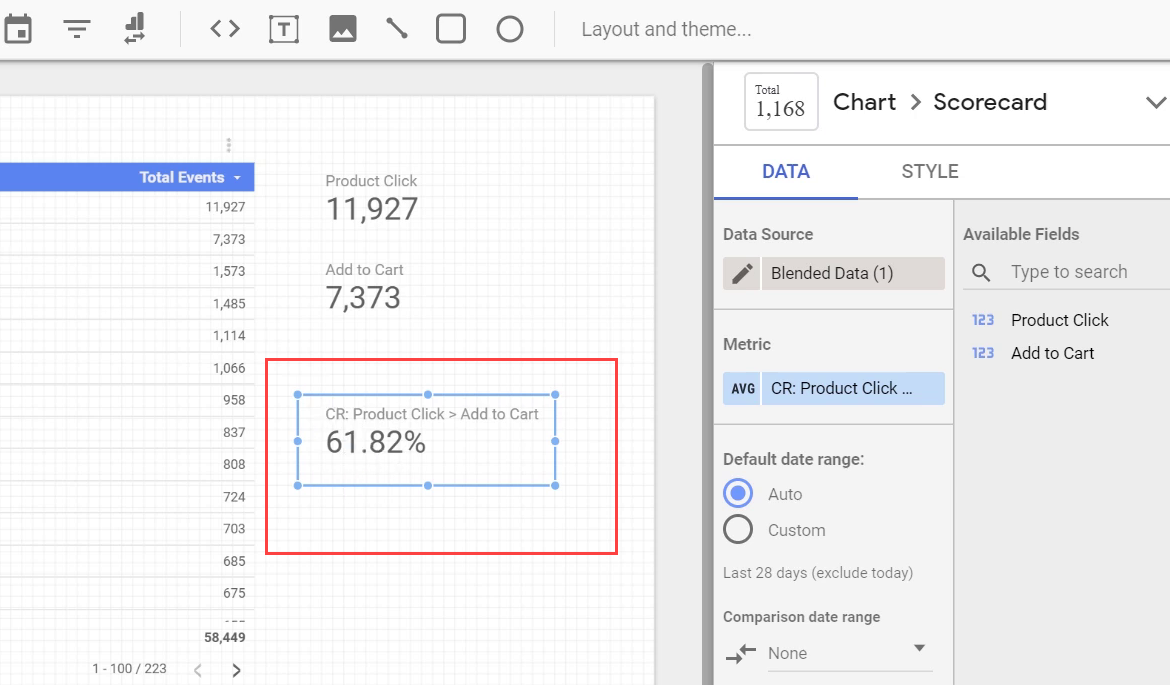
Now it shows the expected average rate of 61.82%, which is logical considering the numbers we have on the table.
You can use this same technique to blend and combine together up to five different metrics of this type. In other words, any blended data source can have up to five different data sources blended together in itself.
For example, we can also have events for product impressions, product checkouts, the product removes from cards, and product purchases. If we have all these five metrics together in a single blended data, then we can divide them together and come up with new metrics such as CTR,
As a result, any metric in Google Analytics and in our data source that we can filter and create a subset of, we can blend them together and use the blended data source to create custom calculated metrics.
Congratulations! You just learned a fast and useful technique on how to calculate the conversion rate between two Google Analytics events within Google Data Studio.
Join Newsletter
Community
Tools
Learn Analytics & CRO


